
How October Stacked Up Across Newfoundland and Labrador
October is in the books, and if it felt like a pretty typical fall month, the numbers mostly agree. Daytime highs ended up close to normal, or a touch above, across most of the province. Most places were drier than usual, and snow was hard to come by, even with that early taste around Halloween.
October at a glance
- Highs: near or slightly above normal on the Island, and about 0.5° to 1.5° above normal in Labrador.
- Rain: drier than normal in most areas. St. John’s and Corner Brook were the exceptions, with a bit more than usual.
- Snow: below normal everywhere it was measured. Gander had 4.4 cm and Deer Lake 1.2 cm, while St. John’s only saw traces of snow.
- Labrador: mild and dry. Happy Valley-Goose Bay’s highs were 1.4° above normal, with only about two thirds of its usual precipitation.
- Warmest day: October 1 for most of the province, with highs near 20° in Corner Brook, Badger and Deer Lake, and even 19.7° in Nain!
Temperatures (average daily high)
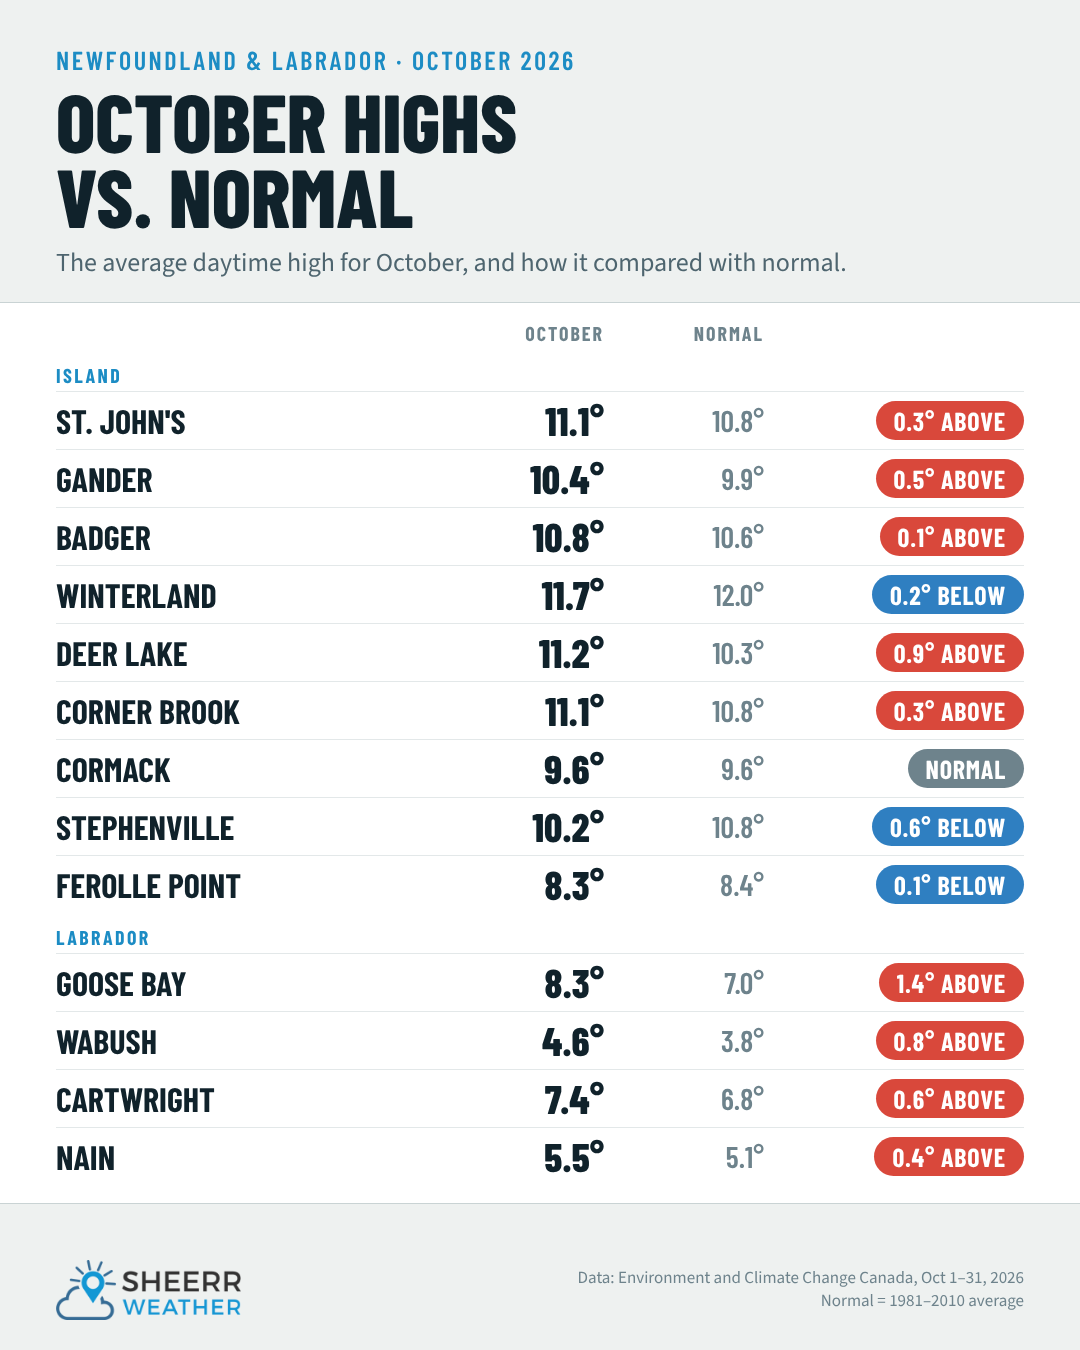
These are the average daily highs for the month, compared with the normal October high for each spot.
| Location | October 2026 | Normal | Difference |
|---|---|---|---|
| St. John’s | 11.1° | 10.8° | +0.3° |
| Gander | 10.4° | 9.9° | +0.5° |
| Badger | 10.8° | 10.6° | +0.1° |
| Winterland (Burin Pen.) | 11.7° | 12.0° | -0.2° |
| Deer Lake | 11.2° | 10.3° | +0.9° |
| Corner Brook | 11.1° | 10.8° | +0.3° |
| Cormack | 9.6° | 9.6° | 0.0° |
| Stephenville | 10.2° | 10.8° | -0.6° |
| Ferolle Point | 8.3° | 8.4° | -0.1° |
| Happy Valley-Goose Bay | 8.3° | 7.0° | +1.4° |
| Wabush | 4.6° | 3.8° | +0.8° |
| Cartwright | 7.4° | 6.8° | +0.6° |
| Nain | 5.5° | 5.1° | +0.4° |
On the Island, most places finished within a degree of normal. Deer Lake was the warmest compared with normal at +0.9°, followed by Gander (+0.5°), St. John’s and Corner Brook (+0.3° each). Stephenville was the one spot that ran a little cool, at -0.6°.
Labrador was the warm spot of the province. Happy Valley-Goose Bay averaged a high of 8.3°, 1.4° above normal. Wabush finished 0.8° above normal, Cartwright 0.6° and Nain 0.4°.
Precipitation (rain and snow combined)
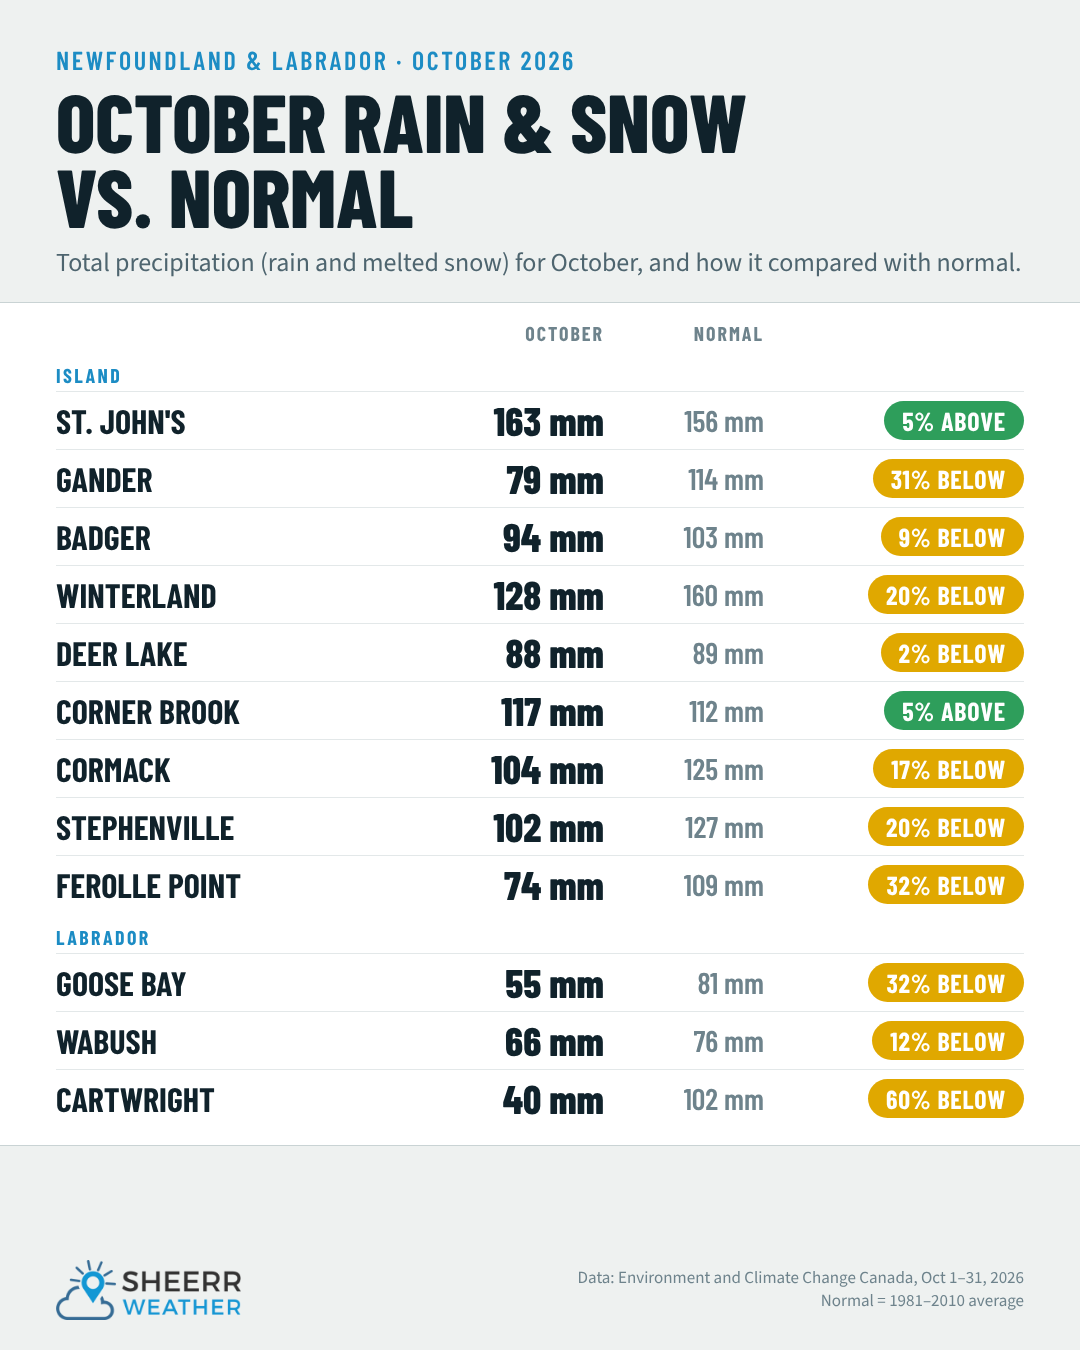
| Location | October 2026 | Normal | % of normal |
|---|---|---|---|
| St. John’s | 163 mm | 156 mm | 105% |
| Gander | 79 mm | 114 mm | 69% |
| Badger | 94 mm | 103 mm | 91% |
| Winterland (Burin Pen.) | 128 mm | 160 mm | 80% |
| Deer Lake | 88 mm | 89 mm | 98% |
| Corner Brook | 117 mm | 112 mm | 105% |
| Cormack | 104 mm | 125 mm | 83% |
| Stephenville | 102 mm | 127 mm | 80% |
| Ferolle Point | 74 mm | 109 mm | 68% |
| Happy Valley-Goose Bay | 55 mm | 81 mm | 68% |
| Wabush | 66 mm | 76 mm | 88% |
| Cartwright | 40 mm | 102 mm | 40% |
St. John’s picked up 163 mm, about 105% of normal, almost all of it as rain. The wettest day was October 15, with 39 mm. Corner Brook was also slightly above normal at 117 mm, and Deer Lake was right on normal.
Most other places were drier. Gander had only 79 mm (69% of normal), and Ferolle Point on the Northern Peninsula had 74 mm (68%). Stephenville and the Burin Peninsula both finished around 80% of normal.
In Labrador, Cartwright was the driest spot in the province compared with normal. It had just 40 mm, 40% of what it usually gets in October. Happy Valley-Goose Bay had 55 mm (68%) and Wabush 66 mm (88%).
Snow
Snowfall is only measured at a handful of stations, and every one of them came in below normal:
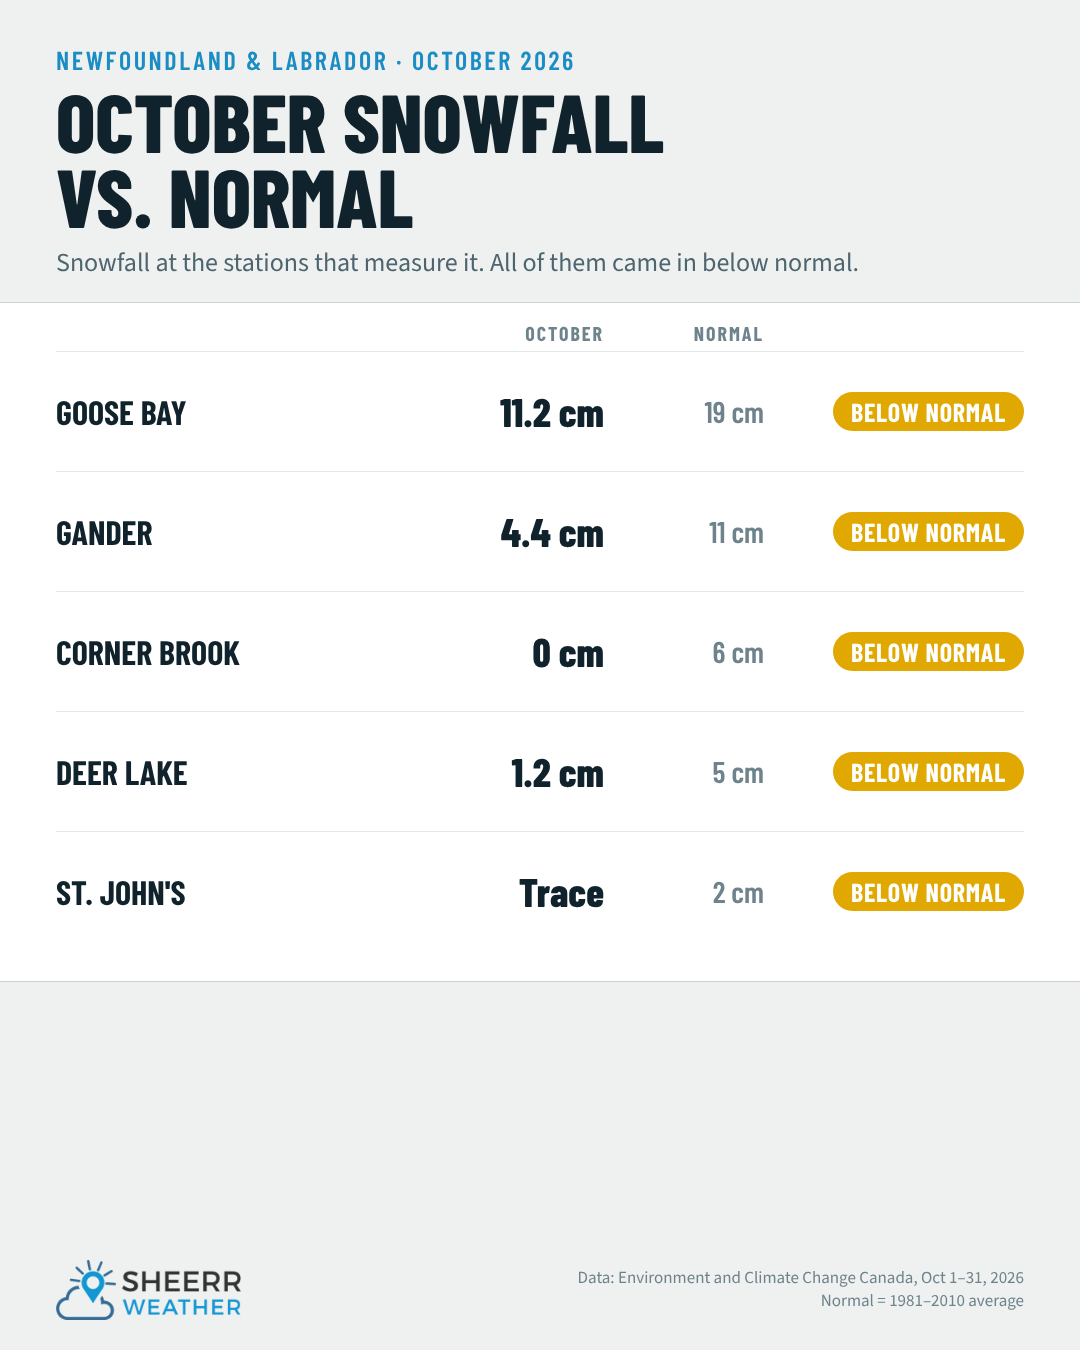
- Happy Valley-Goose Bay: 11.2 cm (normal 19 cm)
- Gander: 4.4 cm (normal 11 cm)
- Deer Lake: 1.2 cm (normal 5 cm)
- Corner Brook: 0 cm (normal 6 cm)
- St. John’s: traces only (normal 2 cm). Environment Canada recorded a trace of snow on October 12 and again on Halloween, plus the graupel on October 13, but less than the 0.2 cm needed to count as a measurable amount.
Wabush normally gets about 39 cm of snow in October. With 88% of its normal precipitation and a milder month, it likely came in under that too, though no snowfall total is reported there.
Looking ahead
November usually brings the first real taste of winter for much of the province, and we’ve already had a cold, windy start. I’ll keep you posted on when the first real snow is headed your way!
Data: Environment and Climate Change Canada daily climate observations for October 2026, compared with the 1981–2010 climate normals. Badger is compared with the normals for nearby Bishop’s Falls, and Ferolle Point with nearby Plum Point.
Don’t forget to download the Sheerr Weather app and check out the Map Room for the latest conditions!
We’ve had worse… but 🤣